转载 本文转自 深入理解JVM - 解读GC日志
前言 这次的文章会根据实战来介绍如何看JVM的日志,看JVM日志说难也难,说容易也容易,更多的是需要时间去不断的尝试进行总结。
概述: 主要内容还是以讲解如何阅读日志,同时不同的机器运行的结果不同,文章更多的是介绍如何解读参数:
配置介绍: 1、新生代5M
实际操作: 不执行任何代码测试: 参数配置:
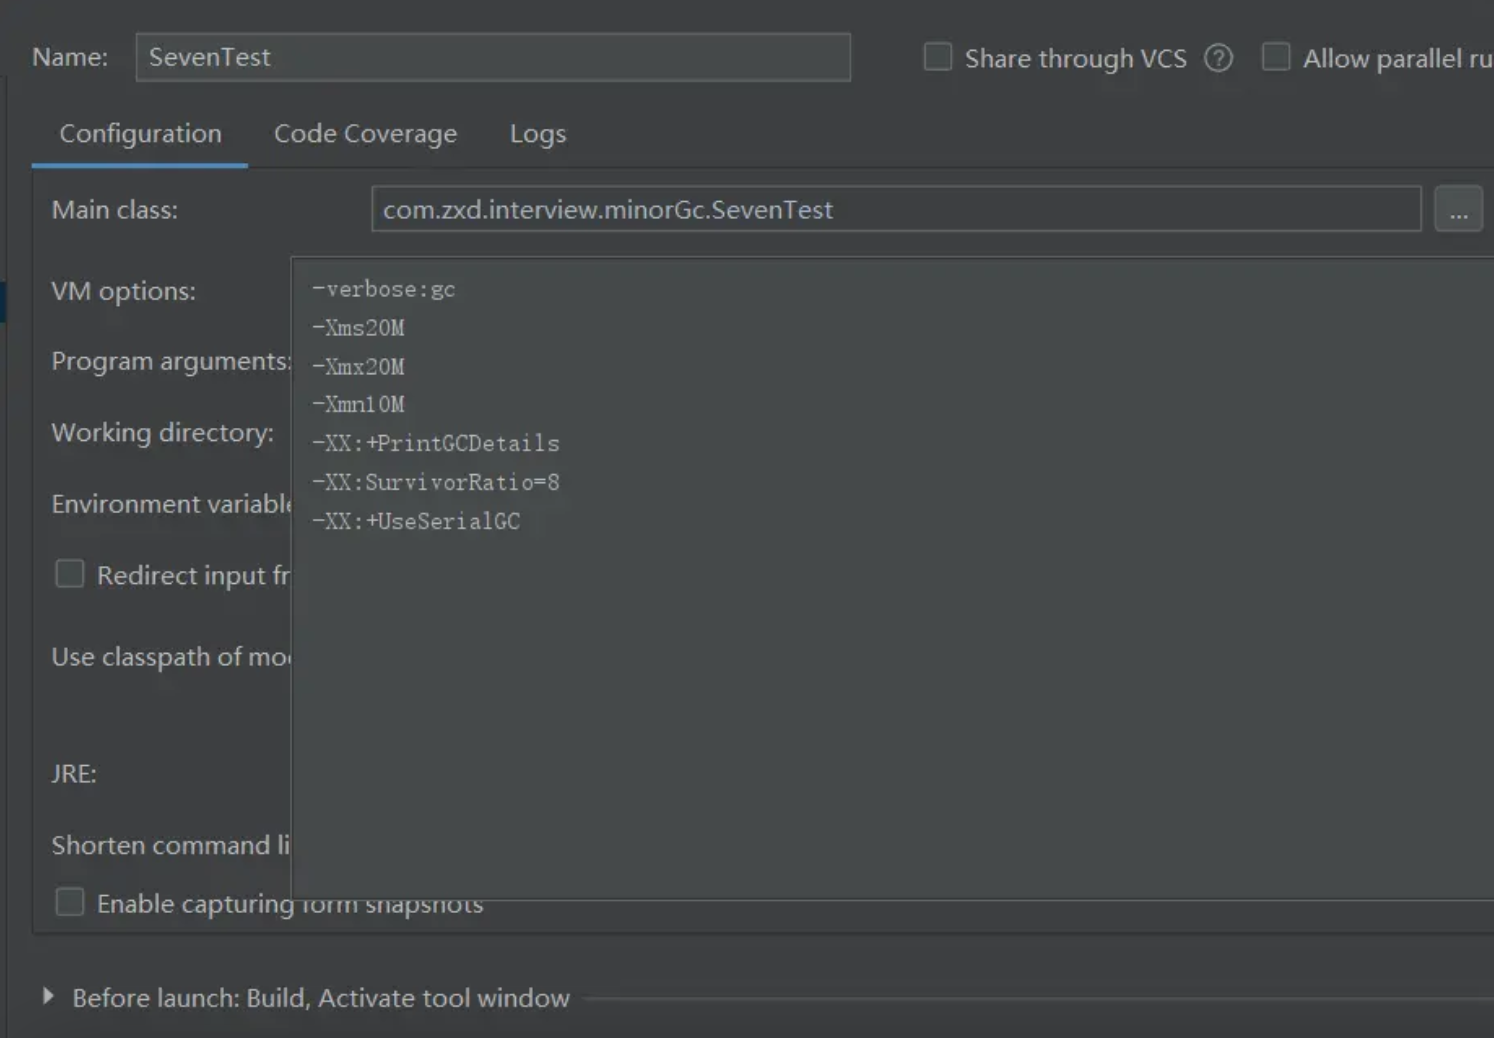
1 -verbose: gc -Xms20M -Xmx20M -Xmn10M -XX :+PrintGCDetails -XX :SurvivorRatio= 8 -XX :+UseSerialGC
参数的含义:
-Xms20M -Xmx20M 给堆分配了20M的内存空间
-Xmn10M 新生代分配10M
-XX:+PrintGCDetails 同时打印GC信息
-XX:SurvivorRatio=8 新生代的分配比例为8:1:1
-XX:+UseSerialGC 使用serrial收集器。注意是serrial收集器。
代码配置 先从最简单的方法开始,我们运行一个没有任何代码的Main方法
1
2
3
4
5
6
7
public class MinorGcTest { public static void main (String[] args) { } }
注意下面的内容是运行一个空Main方法的日志内容。
1
2
3
4
5
6
7
8
9
Heap def new generation total 9216 K , used 3977 K [ 0 x00000000fec00000 , 0 x00000000ff600000 , 0 x00000000ff600000 ) eden space 8192 K , 48 % used [ 0 x00000000fec00000 , 0 x00000000fefe27f0 , 0 x00000000ff400000 ) from space 1024 K , 0 % used [ 0 x00000000ff400000 , 0 x00000000ff400000 , 0 x00000000ff500000 ) to space 1024 K , 0 % used [ 0 x00000000ff500000 , 0 x00000000ff500000 , 0 x00000000ff600000 ) tenured generation total 10240 K , used 0 K [ 0 x00000000ff600000 , 0 x0000000100000000 , 0 x0000000100000000 ) the space 10240 K , 0 % used [ 0 x00000000ff600000 , 0 x00000000ff600000 , 0 x00000000ff600200 , 0 x0000000100000000 ) Metaspace used 3241 K , capacity 4496 K , committed 4864 K , reserved 1056768 K class space used 349 K , capacity 388 K , committed 512 K , reserved 1048576 K
解释:def new generation total 9216K, used 3977K ,很明显,说明新生代总大小为9216K也就是9M的空间大小,为什么是9M呢,因为这里计算的是8M的eden区域+1M的survior from区域,剩下一个survior to的区域加起来一共10M,而可用空间根据复制算法只有9M也是正确的。eden space 8192K, 48% used ,可以看到即使不运行任何的代码我们也使用了4M左右的空间,那么这4M的空间是什么东西呢,这部分对象其实是JVM自身运行产生的一些对象,这里也会放到后面的文章进行解读。
Metaspace代表着元空间,由于JDK8没有了永久代,所以JDK8之前的JVM看到的内容在这里是不一样的。
堆溢出测试: 下面来看下堆溢出的情况下GC的日志打印了哪些内容,JAVA异常的信息忽略了,因为影响我们看日志:
参数配置: 1 -verbose: gc -Xms20M -Xmx20M -Xmn10M -XX :+PrintGCDetails -XX :SurvivorRatio= 8 -XX :+UseSerialGC
代码配置: 1 2 3 4 5 byte [] allocation1, allocation2, allocation3, allocation4, allocation5;allocation1 = new byte [_1MB * 2 ]; allocation1 = new byte [_1MB * 2 ]; allocation1 = new byte [_1MB * 1 ]; allocation3 = new byte [20 *_1MB * 2 ];
下面是日志的结果:
1 2 3 4 5 6 7 8 9 10 11 12 [ GC ( Allocation Failure ) [ DefNew : 7909 K -> 1023 K ( 9216 K ) , 0.0025258 secs ] 7909 K -> 3242 K ( 19456 K ) , 0.0025739 secs ] [ Times : user = 0.00 sys = 0.00 , real = 0.00 secs ] [ GC ( Allocation Failure ) [ DefNew : 2131 K -> 0 K ( 9216 K ) , 0.0015020 secs ] [ Tenured : 4266 K -> 2217 K ( 10240 K ) , 0.0030024 secs ] 4350 K -> 2217 K ( 19456 K ) , [ Metaspace : 3254 K -> 3254 K ( 1056768 K ) ] , 0.0045414 secs ] [ Times : user = 0.00 sys = 0.00 , real = 0.00 secs ] [ Full GC ( Allocation Failure ) [ Tenured : 2217 K -> 2198 K ( 10240 K ) , 0.0017918 secs ] 2217 K -> 2198 K ( 19456 K ) , [ Metaspace : 3254 K -> 3254 K ( 1056768 K ) ] , 0.0018074 secs ] [ Times : user = 0.00 sys = 0.00 , real = 0.00 secs ] Heap def new generation total 9216 K , used 404 K [ 0 x00000000fec00000 , 0 x00000000ff600000 , 0 x00000000ff600000 ) eden space 8192 K , 4 % used [ 0 x00000000fec00000 , 0 x00000000fec65330 , 0 x00000000ff400000 ) from space 1024 K , 0 % used [ 0 x00000000ff400000 , 0 x00000000ff400000 , 0 x00000000ff500000 ) to space 1024 K , 0 % used [ 0 x00000000ff500000 , 0 x00000000ff500000 , 0 x00000000ff600000 ) tenured generation total 10240 K , used 2198 K [ 0 x00000000ff600000 , 0 x0000000100000000 , 0 x0000000100000000 ) the space 10240 K , 21 % used [ 0 x00000000ff600000 , 0 x00000000ff8259d8 , 0 x00000000ff825a00 , 0 x0000000100000000 ) Metaspace used 3360 K , capacity 4496 K , committed 4864 K , reserved 1056768 K class space used 362 K , capacity 388 K , committed 512 K , reserved 1048576 K
1 [ GC ( Allocation Failure ) [ DefNew : 7909 K -> 1023 K ( 9216 K ) , 0.0025258 secs ] 7909 K -> 3242 K ( 19456 K ) , 0.0025739 secs ] [ Times : user = 0.00 sys = 0.00 , real = 0.00 secs ]
我们先看一下第一行,这里使用的是serrial收集器,所以可以看到新生代打印7909K->1023K(9216K),表示一共可用空间9216KB,而垃圾此时占用了7909K,回收之后剩下1023K。第二部分:7909K->3242K(19456K),表示整个堆的回收情况,19456K表示整个堆的可用空间,同样从堆大小可以看到从7909K回收到剩下3242K的存活对象。最后一部分:[Times: user=0.00 sys=0.00, real=0.00 secs] 表示停顿的时间,以毫秒为单位,因为此次的垃圾回收时间太短,所以没有金酸进去,user表示用户线程停顿时间,sys表示系统回收时间,real表示实际的停顿时间。
接着看一下full gc的日志,可以看到这里直接对于新生代和老年代回收内存之后发现几乎没有空间剩余,还是放不下20M的大对象,所以直接抛出了oom。
1
2
[ Full GC ( Allocation Failure ) [ Tenured : 2217 K -> 2198 K ( 10240 K ) , 0.0017918 secs ] 2217 K -> 2198 K ( 19456 K ) , [ Metaspace : 3254 K -> 3254 K ( 1056768 K ) ] , 0.0018074 secs ] [ Times : user = 0.00 sys = 0.00 , real = 0.00 secs ] Heap
parNew+cms测试: 不执行任何测试 参数配置: 注意最后使用了parnew+cms的组合
1
2
3
4
5
6
7
8
-verbose:gc -Xms20M -Xmx20M -Xmn10M -XX:+PrintGCDetails -XX:SurvivorRatio=8 -XX:+UseParNewGC -XX:+UseConcMarkSweepGC
代码配置: 同样是不执行任何的代码,结果和其他的收集器类似
1
2
3
4
5
6
7
8
Heap par new generation total 9216 K , used 3977 K [ 0 x00000000fec00000 , 0 x00000000ff600000 , 0 x00000000ff600000 ) eden space 8192 K , 48 % used [ 0 x00000000fec00000 , 0 x00000000fefe27f0 , 0 x00000000ff400000 ) from space 1024 K , 0 % used [ 0 x00000000ff400000 , 0 x00000000ff400000 , 0 x00000000ff500000 ) to space 1024 K , 0 % used [ 0 x00000000ff500000 , 0 x00000000ff500000 , 0 x00000000ff600000 ) concurrent mark - sweep generation total 10240 K , used 0 K [ 0 x00000000ff600000 , 0 x0000000100000000 , 0 x0000000100000000 ) Metaspace used 3255 K , capacity 4496 K , committed 4864 K , reserved 1056768 K class space used 353 K , capacity 388 K , committed 512 K , reserved 1048576 K
如果去掉cms? 如果我们把上面的参数去掉-XX:+UseConcMarkSweepGC,会出现下面的内容:
1
2
3
4
5
6
7
8
9
10
Heap par new generation total 9216 K , used 3977 K [ 0 x00000000fec00000 , 0 x00000000ff600000 , 0 x00000000ff600000 ) eden space 8192 K , 48 % used [ 0 x00000000fec00000 , 0 x00000000fefe27f0 , 0 x00000000ff400000 ) from space 1024 K , 0 % used [ 0 x00000000ff400000 , 0 x00000000ff400000 , 0 x00000000ff500000 ) to space 1024 K , 0 % used [ 0 x00000000ff500000 , 0 x00000000ff500000 , 0 x00000000ff600000 ) tenured generation total 10240 K , used 0 K [ 0 x00000000ff600000 , 0 x0000000100000000 , 0 x0000000100000000 ) the space 10240 K , 0 % used [ 0 x00000000ff600000 , 0 x00000000ff600000 , 0 x00000000ff600200 , 0 x0000000100000000 ) Metaspace used 3238 K , capacity 4496 K , committed 4864 K , reserved 1056768 K class space used 349 K , capacity 388 K , committed 512 K , reserved 1048576 K Java HotSpot ( TM ) 64 - Bit Server VM warning : Using the ParNew young collector with the Serial old collector is deprecated and will likely be removed in a future release
这里注意一下最后一句:
1 Java HotSpot(TM) 64 -Bit Server VM warning : Using the ParNew young collector with the Serial old collector is deprecated and will likely be removed in a future release
总结: 根据上面的几个测试案例可以看到,阅读GC的日志还是比较简单的,但是实际运行又会发现由于各种因素的干扰,实际运行的结果会和预期的结果不一样,这里不需要过多的担心,因为只要掌握了基础的理论,在根据实践模拟不断的熟悉会发现JVM的垃圾回收规律基本还是符合我们的理论基础介绍的。
写在最后 阅读日志建议更多的是实操和练习,多尝试几遍之后更能加深记忆,由于个人机器本身不跑任何代码也会产生4M的对象,所以只能简单的介绍阅读日志的方法了…..